Interpolate a pubertal stage trajectory along reference curves
Source:R/trajectory.R
interpolate_trajectory.RdComputes the x/y coordinates needed to plot a patient's pubertal stage trajectory along the reference curves, including the interpolated segments between measurement ages within the same stage.
Value
A list with components x, y, stage and
patient (a logical flag indicating whether a point is an
observed patient measurement or an interpolated reference point).
Examples
# reference ages and genital stage percentile curves for boys
refx <- seq(8, 21, 0.25)
refy <- tanner::nl1997_lines$gen[, -1]

# a boy observed at G1 at age 10, still G1 at age 11, then G3 at age 13
patx <- c(10, 11, 13)
pats <- c(1, 1, 3)

curve <- interpolate_trajectory(
  refx = refx, refy = refy, patx = patx, pats = pats
)
curve
#> $x
#> [1] 10.00 10.25 10.50 10.75 11.00 13.00
#>
#> $y
#> [1] -0.3655512 -0.4074194 -0.4519569 -0.4992546 -0.5530926  0.3237861
#>
#> $stage
#> [1] 1 1 1 1 1 3
#>
#> $patient
#> [1]  TRUE FALSE FALSE FALSE  TRUE  TRUE
#>

# curve$patient flags the observed measurements; the other points
# interpolate along the reference curve between them
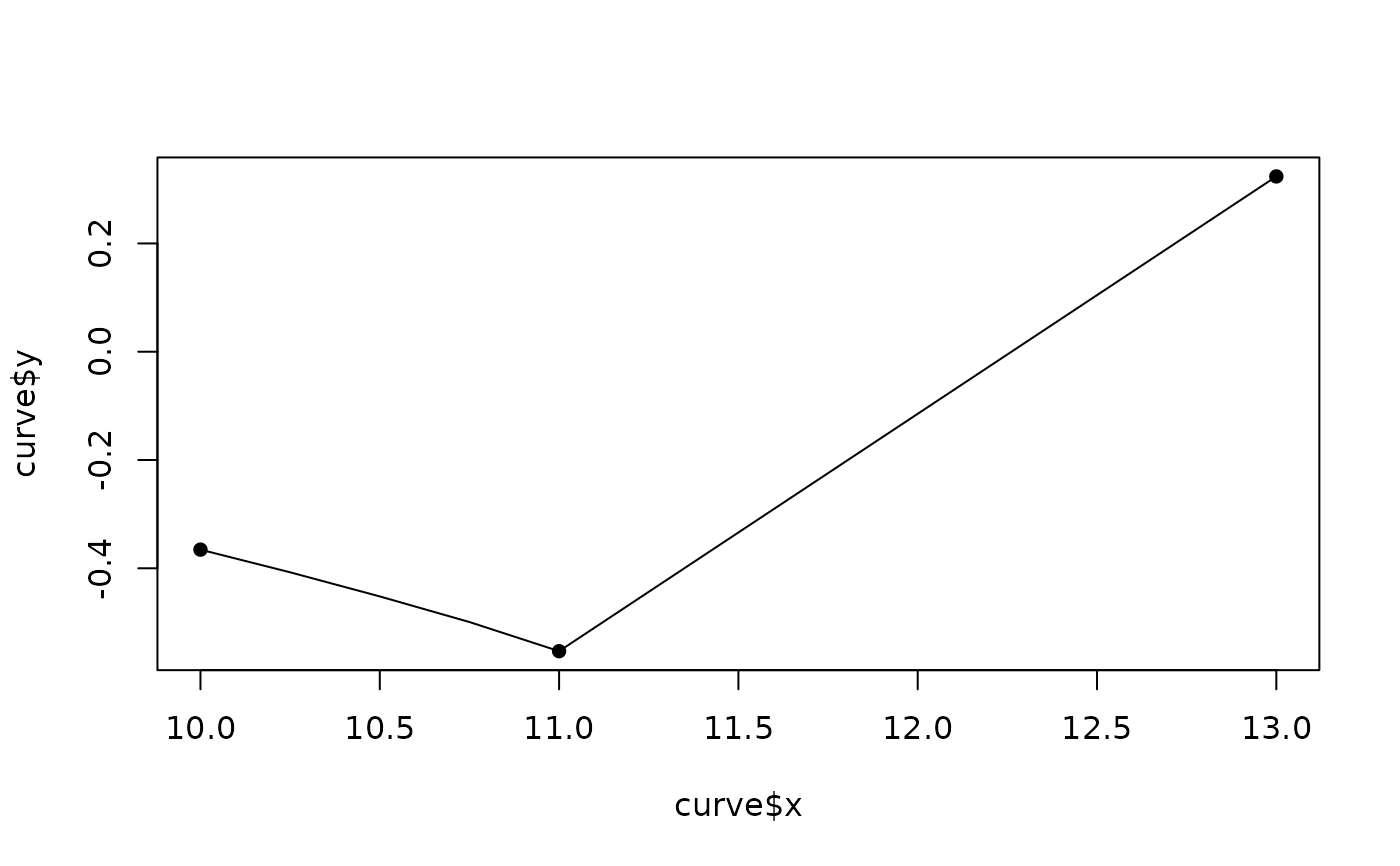
plot(curve$x, curve$y, type = "l")
points(curve$x[curve$patient], curve$y[curve$patient], pch = 16)